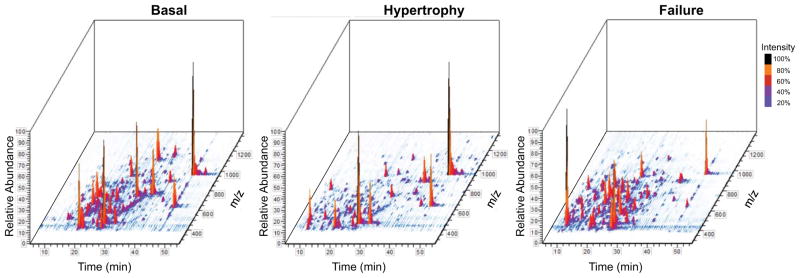
Figure 3. 3D rendering of total ion chromatogram.

The total ion chromatogram (TIC) from an LC/MS run can be viewed in 3-dimensions to display all peptides detected as individual peaks. The 3D-TIC of acid-extracted chromatin proteins from basal (left panel), hypertrophic (middle panel) and failing (right panel) mouse myocardium illustrate the changes in protein abundance that occur during disease progression. Figures generated using Qual Browser embedded in Xcalibur software. X-axis (time), Y-axis (intensity), Z-axis (m/z).
