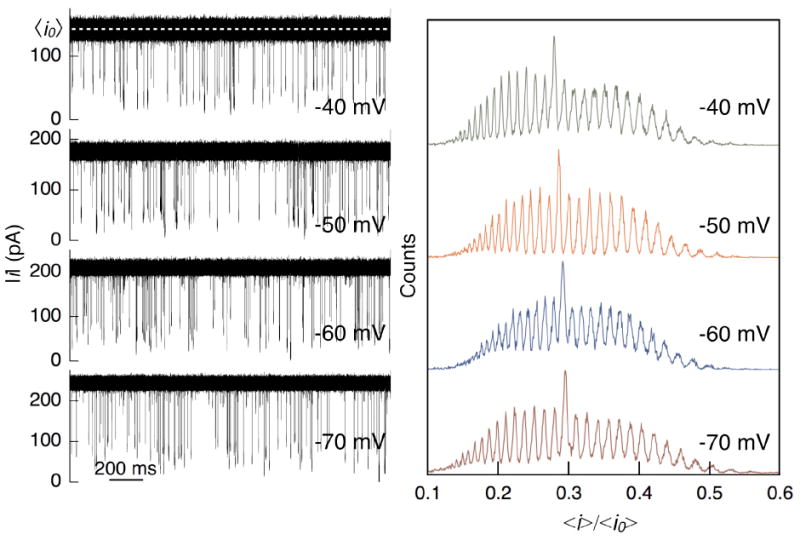
Figure 7.

Experimental measurements of PEG mixtures (mean molecular weight of 1000 g/mol and 1500 g/mol in 4 M KCl at pH 7.2) with a single αHL nanopore. (Left) Time-series of ionic currents are shown at four transmembrane potentials. The mean open channel current (<i0>, dashed white at -40 mV) increases with applied potential. PEG partitions into the channel and reduces its conductance (<i>) proportional to the molecule size. Individual PEG events are then analyzed to estimate the blockade depth (<i>/<i0>). (Right) Distribution of <i>/<i0> at four applied transmembrane potentials. The peaks represent uniquely sized polymers, discriminated with single monomer resolution. A systematic shift of the peaks to the right across the four plots highlight the inverse dependence of <i>/<i0> with applied potential.
