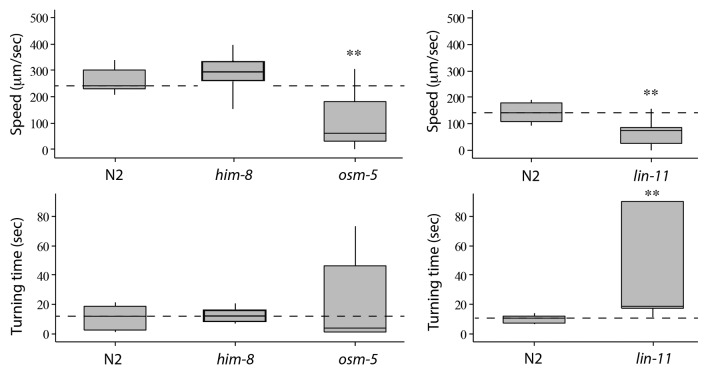
Figure 2. Electrotaxis speed and turn time responses of wild-type N2 and mutant animals. The lower and upper lines of each box represent the 25th and 75th quartile of data sample, respectively. The middle line inside the box marks the median. The end points of the vertical line (both top and botom) are the maximum and minimum data points of the sample, respectively. The dotted horizontal line corresponds to the median of the control. The him-8 worms are comparable to wild-type, whereas osm-5 and lin-11 move slower than N2 and take much longer time to turn. Statistically significant responses are marked with stars (*: p < 0.05, **: p < 0.01, ***: p < 0.0001).

An official website of the United States government
Here's how you know
Official websites use .gov
A
.gov website belongs to an official
government organization in the United States.
Secure .gov websites use HTTPS
A lock (
) or https:// means you've safely
connected to the .gov website. Share sensitive
information only on official, secure websites.
