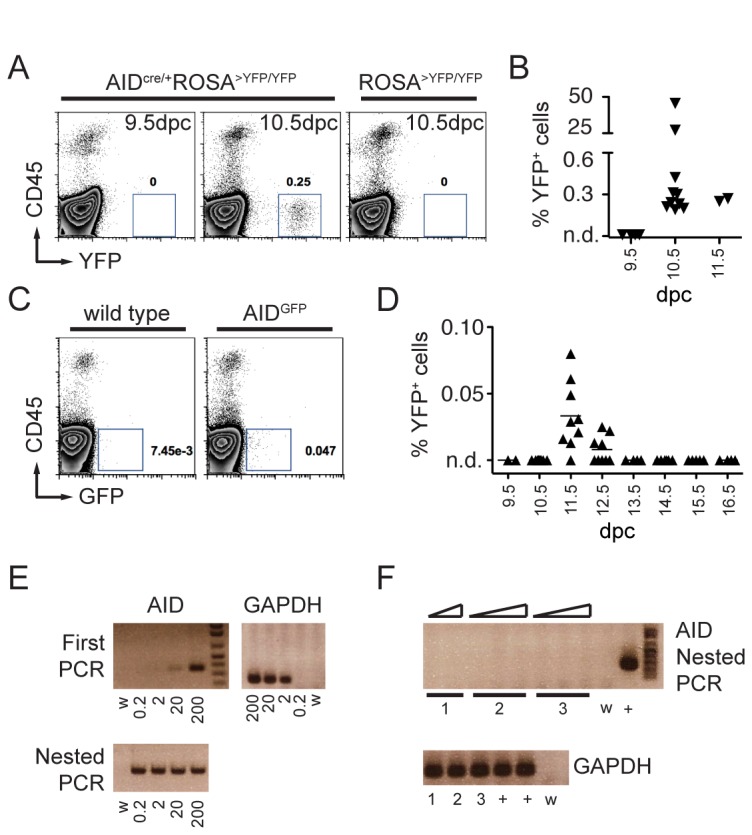
Figure 2. AID during development.

A. Representative FACS plots of whole embryos revealing YFP + CD45- cells starting at 10.5 dpc. Numbers are the percentage of YFP+ cells in the shown gate. B. Summary dot plot with the percentage of YFP + CD45- cells in AIDcre/+ ROSA>YFP/YFP embryos at the indicated days post conception (dpc). Each triangle represents an individual embryo. n.d. is non-detectable over control. C. Representative FACS plots showing AIDGFP+ cells at dpc 11.5. D. Summary dot plot with the percentage of GFP+ cells in AIDGFP embryos at the indicated developmental stages (days post conception). Each triangle represents an individual embryo. For dpc 9.5-12.5, cells from the whole embryo were analyzed; for dpc 13.5-16.5 analysis was limited to the upper body half. n.d. is non-detectable over wild type control. E. Ethidium bromide stained agarose gels with RT-PCR products obtained from sorted AIDGFP+ germinal center B cells from Peyer’s Patches (positive control). Numbers represent cell equivalents, w is water control. GAPDH control is shown alongside. F. RT-PCR products from sorted AIDGFP+ cells at 11.5 dpc from three independent experiments (lanes 1, 2, and 3). Triangles represent increasing amounts of template cDNA. Cell equivalents for the AID nested PCR were: 10, 20 (experiment 1); 5, 10, 50 (experiment 2); 1, 2, 10 (experiment 3). + is positive control and w is water. Cell equivalents for GAPDH were 10, 10, and 5 for experiments 1, 2, and 3 respectively.
