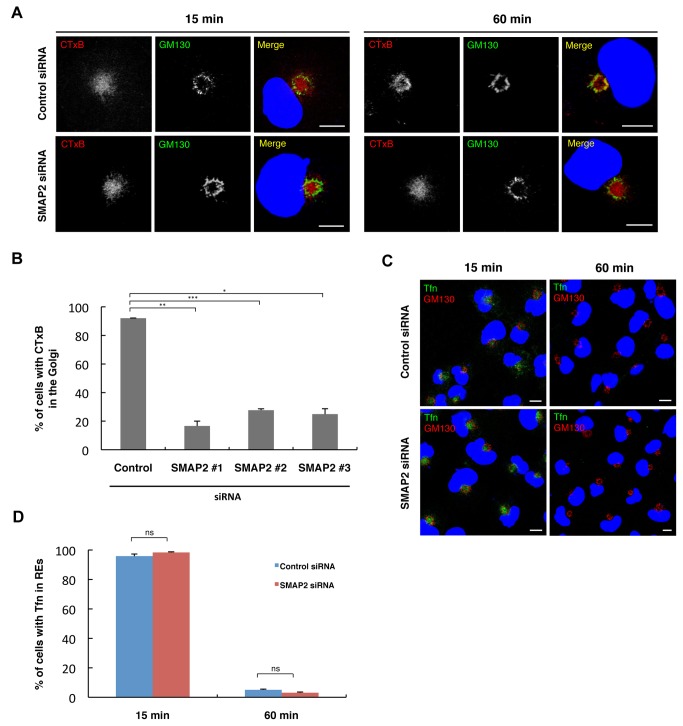
Figure 3. Knockdown of SMAP2 impaired the retrograde transport of CTxB from REs.
(A) Cells treated with control siRNA (left column) or SMAP2 siRNA#1 (right column) were pulsed for 3 min at 37°C with Alexa594-CTxB and chased for the indicated times. Cells were then fixed, permeabilized, and stained for GM130. Nuclei were stained with DAPI (blue). (B) Cells in (A) were examined visually if CTxB reached the Golgi. The percentage of cells in which CTxB reached the Golgi after a 60-min chase was shown. Data represent mean ± SD, n > 150 cells. *P < 0.05, **P < 0.01, ***P < 0.001, Student’s two-tailed t test. (C) Cells treated with control or SMAP2 siRNA#1 were pulsed for 5 min at 37°C with Alexa488-Tfn and chased for the indicated times. Cells were then fixed, permeabilized, and stained for GM130. Nuclei were stained with DAPI (blue). (D) Cells in (C) were examined visually if Tfn was in REs. The percentage of cells in which Tfn was in REs at the indicated times was shown. Data represent mean ± SD, n > 70 cells. ns, not significant, Student’s two-tailed t test. Scale bars, 10 µm.

