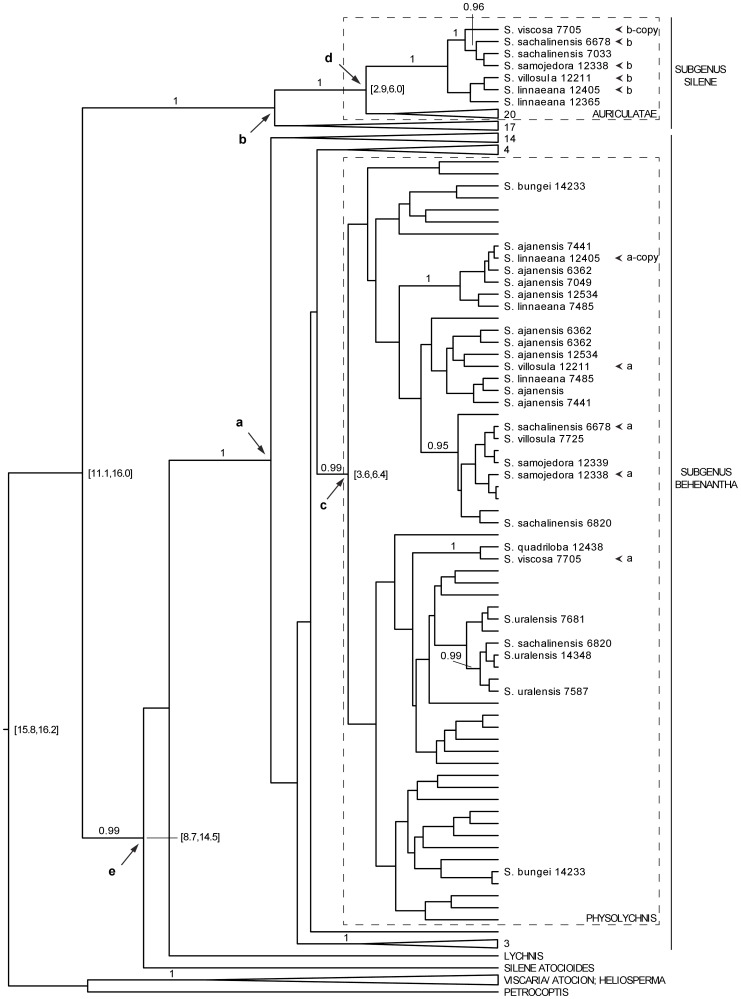
Figure 2. Maximum clade credibility tree from the dated NRPA2 phylogeny.
Clades are collapsed and taxon names removed if insignificant for the discussion, but within the ingroup followed by a number denoting the number of taxa retained within the clade (in Figure S2). Numbers following taxon names correspond to specimen IDs in the Sileneae database [18]. Bayesian posterior probabilities ≥0.95 are plotted above branches leading to clades relevant to this study. 95% HPD age intervals are indicated within square brackets opposite nodes that are relevant to the discussion. Individuals containing both an a- and a b-copy are high-lighted with arrowheads. Nodes discussed in the text are labeled a through e.

