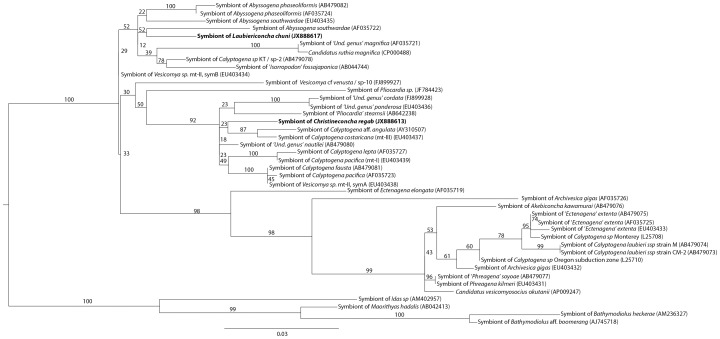
Figure 3. 16S rRNA maximum-likelihood tree.
The evolutionary model tested was GTR+I+G (proportion of invariable sites = 0.66, number of substitution rates = 6, gamma distribution parameter = 0.64). Bootstrap values for 1000 replicates are given in percent above branches and clades. Scale bars are expressed as number of substitutions per base pair. ‘Und. genus’) indicates a temporary genus name. Sp-1 to 9 correspond to species numbers given in Audzijonyte et al. 2012.

