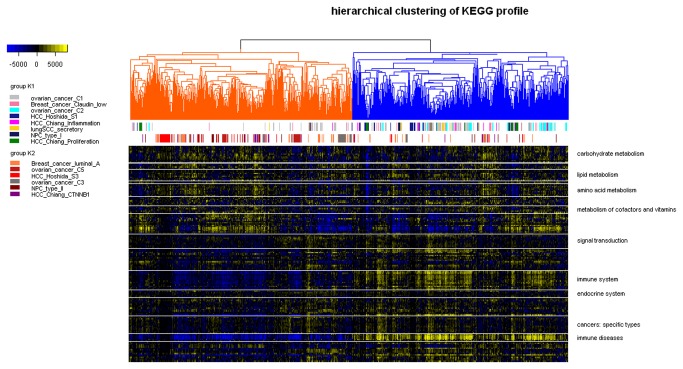
Figure 3. Pathway profiles across six human cancers.
Each grid represents a score of pathway activity calculated by single-sample GSEA. No further adjustment of the ssGSEA score was performed. Pathways were ordered by category manually and separated from others using horizontal white lines. Only categories with more than five pathways were labeled. The dendrogram was split into two groups with group K1 colored by blue and group K2 colored by orange. The upper horizontal color bar marked subtypes overrepresented in group K1 while the lower horizontal color bar marked subtypes overrepresented in group K2. Most subtypes were significantly enriched (p-value < 0.05, Chi-squared test) except HCC Chiang’s Proliferation and CTNNB1 (p-value = 7.27e-02 and 7.86e-02, respectively).

