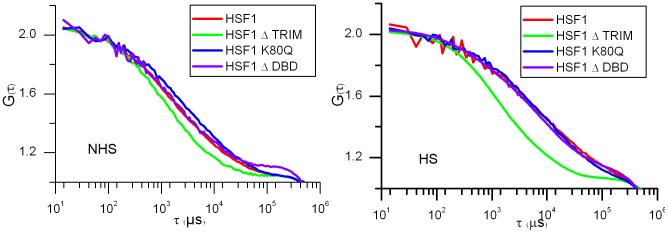
Figure 3. mFCS analysis of the WT HSF1 and mutants in unstressed and stressed cells.

Comparison between the dynamics of WT HS1 and mutants analyzed by mFCS. Autocorrelation function (ACF) curves of HSF1 before (NHS) and after a one hour heat shock (HS). The ACF functions are normalized for molecule number. Abscissa is related to diffusion times. WT HSF1-eGFP (red), HSF1-ΔTRIM-eGFP (green), HSF1-K80Q-eGFP (blue) and HSF1-ΔDBD-eGFP (purple).
