
Figure 13. FRAP analysis of the WT HSF1 and mutants in unstressed and stressed cells.
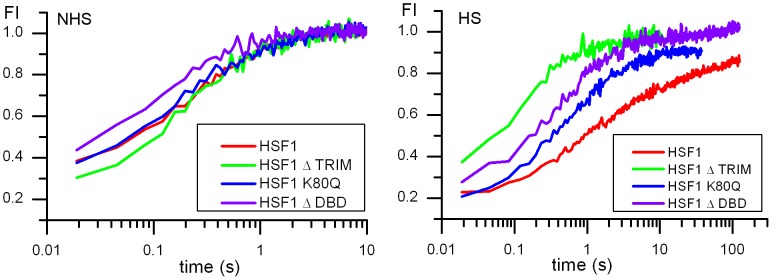
Fluorescence recovery curves after photobleaching of HSF1 full length-eGFP before (NHS) and after heat shock (HS) in the nucleus. WT HSF1-eGFP (red), HSF1-ΔTRIM-eGFP (green), HSF1-K80Q-eGFP (blue) and HSF1-ΔDBD-eGFP (purple).