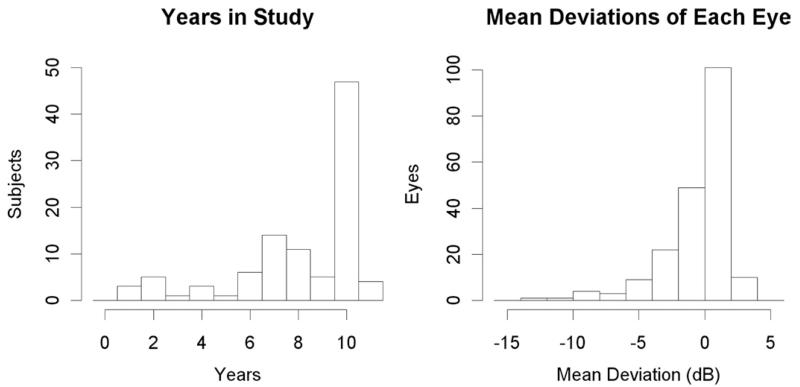
Figure 1.
Population characteristics for the study. The first histogram shows the number of years each subject has been in the study and receiving annual testing. The second histogram shows the mean deviations of each eye, according to SAP, measured in decibels. Note that both eyes are included in the second histogram, so there are twice as many data points.

