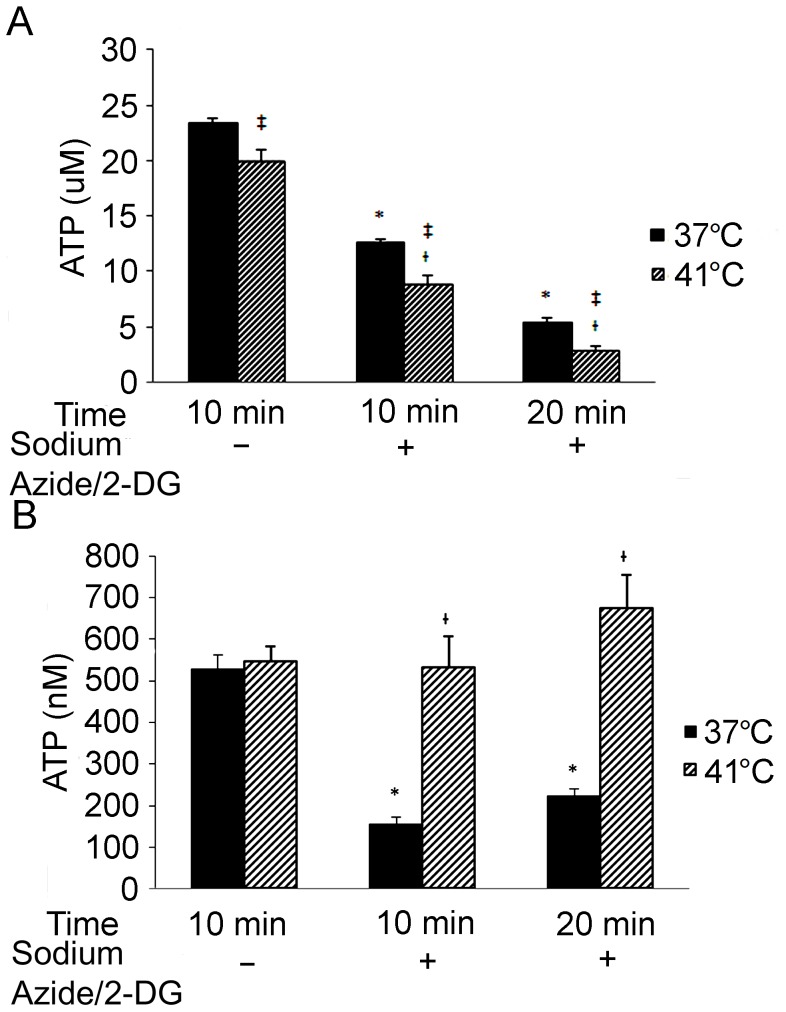
Figure 4. Intracellular and extracellular ATP levels changed following treatments.
Neuronal death was induced by treating the cells with 0.5 mM 2-DG and 5 mM sodium azide for the indicated time. Control cells were incubated with fresh regular medium for 10 minutes. (A) Intracellular ATP was measured. Error bars represent mean ± SEM. n = 4. * denotes significant difference from 37°C controls (p<0.01); † denotes significant difference from 41°C control (p<0.01); ‡ denotes significant difference from the cells received the treatment at 37°C (p<0.05). (B) Extracellular ATP was measured in the culture medium following the treatments. Error bars represent mean ± SEM. n = 4. *denotes significant difference from 37°C controls (p<0.01); † denotes significant difference from the group received the treatment with sodium azide/2-DG at 37°C (p<0.01).

