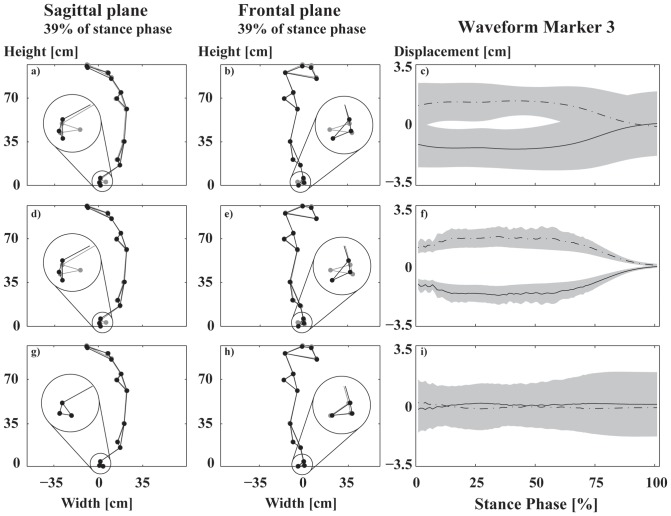
Figure 3. Visualization of movement differences.
Stick figures of all markers in the sagittal plane (a,d,g) and the frontal plane (b,e,h). The waveforms of marker three that separated both shoe conditions are shown in the third column (c,f,i). The first row (a-c) shows the result using the classifying PCA base. The second row (d-f) shows the approach using the SVM base. The third row (g-i) shows the orthogonal complement to the SVM base. The differences of the stick figures are visualized using a magnification factor of 5. The black and grey dots in the stick figures represent the viscoelastic and elastic midsole, respectively. The largest changes were found at the ankle (circle). The figures in the third column show the waveforms and their standard deviations (gray shaded area) for the two shod conditions. The dashed line represents the elastic midsole and the solid line the viscoelastic midsole.

