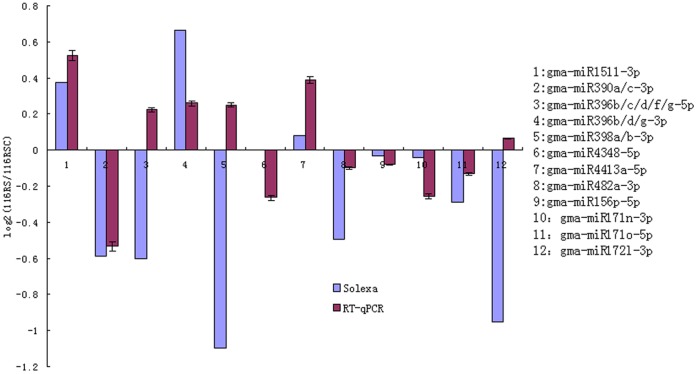
Figure 6. Comparison between qRT-PCR and the deep sequencing in No.116 root exposed to short-term low nitrogen stress.
The y-axis indicate the relative expression levels of twelve selected miRNA in qRT-PCR and in Solexa sequencing analysis. The x-axis indicates twelve selected miRNAs, which are respectively as follows: 1. gma-miR1511-3p; 2. gma-miR390a/c-3p; 3. gma-miR396b/c/d/f/g-5p; 4. gma-miR396b/d/g-3p; 5. gma-miR398a/b-3p; 6. gma-miR4348-5p; 7. gma-miR4413a-5p; 8. gma-miR482a-3p; 9. gma-miR156p-5p; 10. gma-miR171n-3p; 11. gma-miR171o-5p; 12. gma-miR172l-3p. gma-miR1520d-3p and gma-miR156b-5p was chosen as endogenous reference genes.

