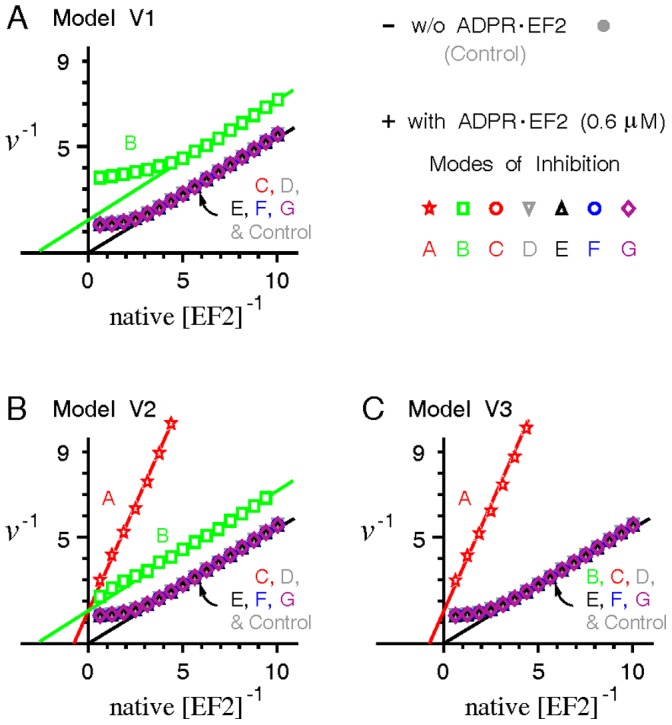
Figure 9. Double reciprocal plots of the elongation velocity v versus native EF2 in the absence and presence of a fixed amount of ADPR•EF2.

A mixture of ADPR•EF2 (0.6 µM) and native EF2 in various concentrations was added into a cell-free poly(U)-translating system containing a constant [R]t = 0.5 µM. The resulting stead-state elongation velocity v was recorded and plotted reciprocally versus the concentration of native EF2. Note that the elongation velocity v under the inhibition mode A of model V1 is zero and hence could not be displayed in the reciprocal form.
