
Figure 2. Variations in cost-effectiveness results by funding source and prevention category: a) Primary CV prevention and b) Secondary CV prevention.
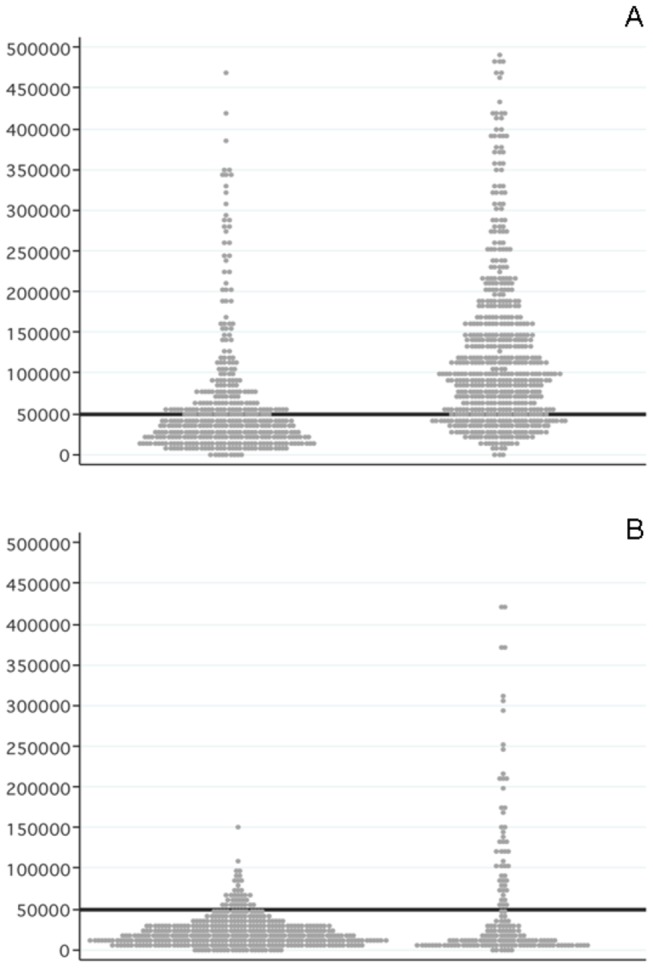
CV: Cardiovascular.
Note: Each dot represents an incremental cost (in US$) per QALY/LYG in the reviewed articles. The horizontal line represents the willingness-to-pay threshold.