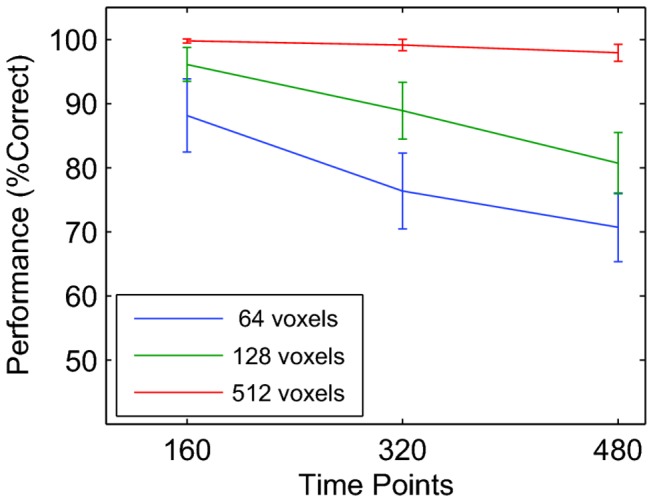
Figure 1. Mean classification performance in a two-class block design experiment.

The randomly cross-validated percentage correct (y-axis) is shown as a function of the number of time points (x-axis) for three ROI sizes (64, 128,and 512 voxels). Error bars show the standard deviation across 1000 independent null data sets. This figure shows that using randomly chosen time points for cross-validation generates spurious classification performance.
