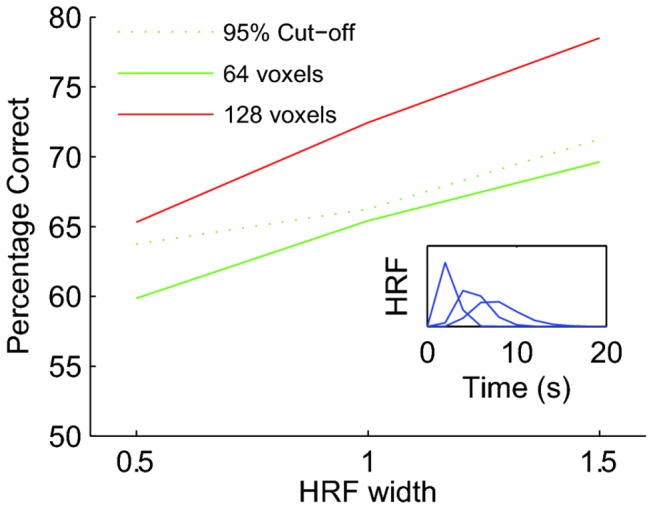
Figure 5. The HRF in a region of interest affects classification performance.

The green and red curves show mean performance on data sets with true neural signal (signal strength s was 0.1; see main text), Green curve: mean performance on 64 voxels, red curve: mean performance on 128 voxels. Dashed curve: level of performance achieved on 95% of a null data sets consisting of 64 voxels (i.e. the significance cut-off). This figure shows that stretching the HRF by 50% can increase classification performance by nearly 10%. In other words, if it is possible that the HRF could differ between two data sets, then a difference in classification performance cannot be used to infer a difference in the underlying neural response.
