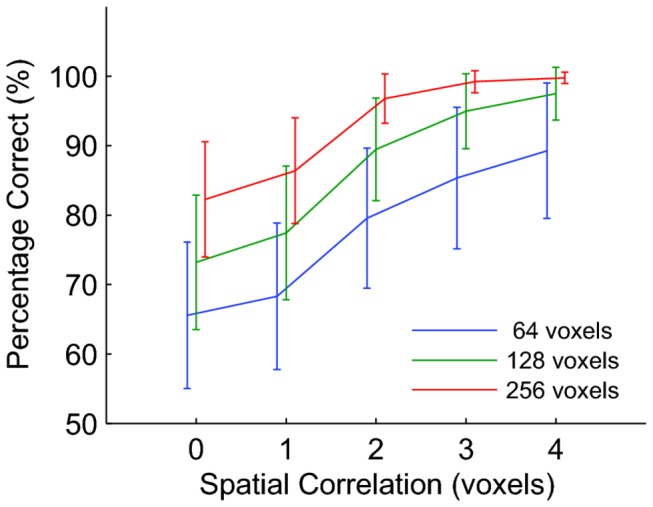
Figure 6. Spatial correlations affect classification performance.

Each curve shows the mean classification performance based on a data sets containing true signal (s = 0.1) for a different ROI size as shown in the legend. Error bars show ±1 standard deviation across 1000 independent data sets. Spatial correlation on the x-axis represents the standard deviation of the Gaussian spatial filter, which we use to simulate the spatial spread of the BOLD response. Data points are offset horizontally for visual clarity. This figure shows that spatial correlations in the BOLD response induced by a spatially unspecific vasculature can inflate classification performance estimates.
