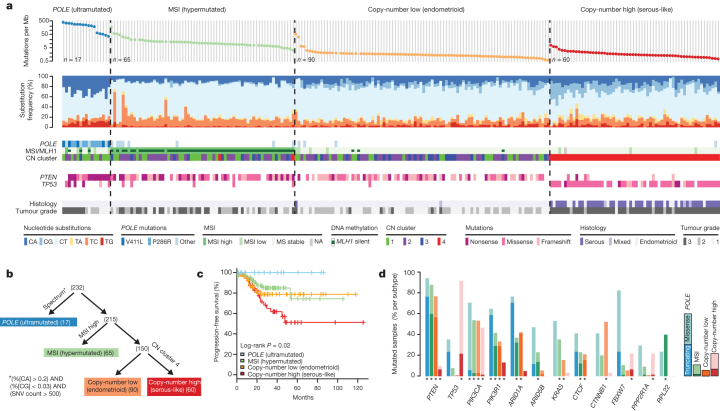
Figure 2. Mutation spectra across endometrial carcinomas.
a, Mutation frequencies (vertical axis, top panel) plotted for each tumour (horizontal axis). Nucleotide substitutions are shown in the middle panel, with a high frequency of C-to-A transversions in the samples with POLE exonuclease mutations. CN, copy number. b, Tumours were stratified into the four groups by (1) nucleotide substitution frequencies and patterns, (2) MSI status, and (3) copy-number cluster. SNV, single nucleotide variant. c, POLE-mutant tumours have significantly better progression-free survival, whereas copy-number high tumours have the poorest outcome. d, Recurrently mutated genes are different between the four subgroups. Shown are the mutation frequencies of all genes that were significantly mutated in at least one of the four subgroups (MUSiC, asterisk denotes FDR < 0.05).

