
Figure 1.
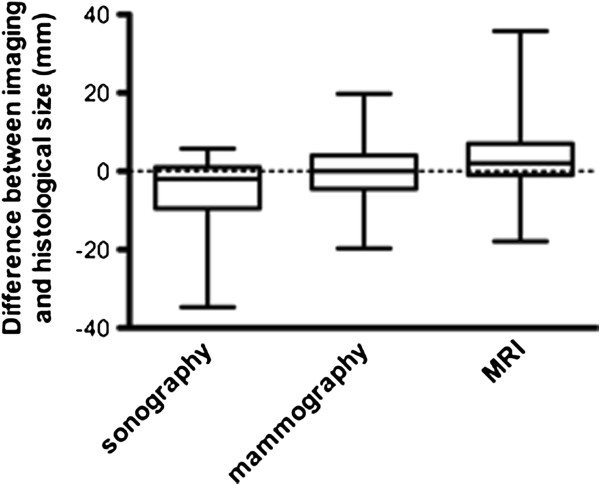
Box Plots illustrating the median size difference between imaging (sonography, mammography and MRI) and histology and the corresponding interquartile range with whiskers from the 5th to the 95th percentile.
Official websites use .gov
A
.gov website belongs to an official
government organization in the United States.
Secure .gov websites use HTTPS
A lock (
) or https:// means you've safely
connected to the .gov website. Share sensitive
information only on official, secure websites.
Box Plots illustrating the median size difference between imaging (sonography, mammography and MRI) and histology and the corresponding interquartile range with whiskers from the 5th to the 95th percentile.