Figure 4.

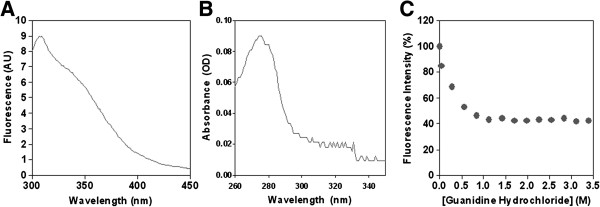
Fluorescence and absorption spectra. A) Fluorescence emission (Exλ = 280 nm) and B) absorbance spectra of α-DG(316–484) in PBS, pH 7.4. C) Effect of raising concentrations of guanidine hydrochloride on the fluorescence intensity of α-DG(316–484).
