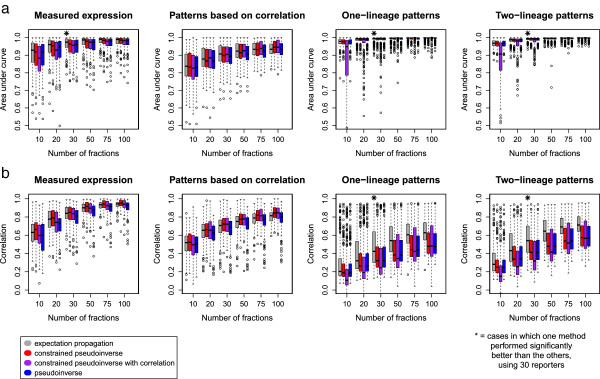
Figure 3.

Prediction accuracy for several real and simulated data sets, measured by a) area under the ROC curve or b) Pearson correlation. An area under the curve of 0.5 corresponds to random on-off predictions, while an area under the curve of 1 corresponds to perfect prediction accuracy. (Data sets are described in the text). Cases in which one method performed significantly better than the other three (paired t-test, p=0.05, Bonferroni-corrected for 24 tests) are marked with a star.
