
Figure 5.
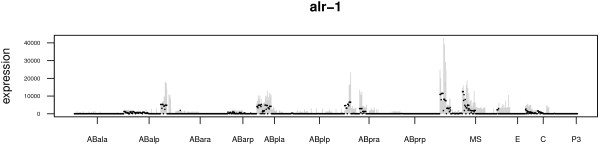
Prediction bounds for a typical gene, alr-1, computed using the Constrained Pseudoinverse and Markov Chain Monte Carlo Sampling, based on simulated measurements of thirty fractions. Actual expression is shown in black, while grey bars show predicted expression (as a two-standard-deviation interval).