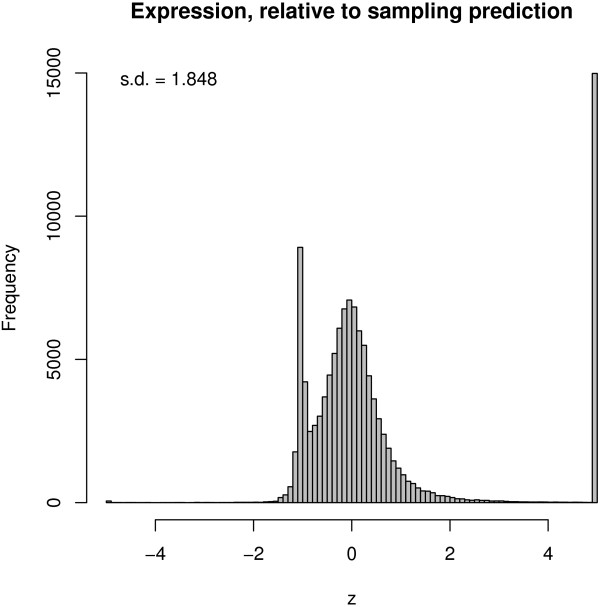
Figure 6.
Comparison of sampling prediction intervals with actual expression. z-score of actual expression was plotted, scaled to the mean and standard deviation of the prediction from sampling. For example, if the real error were equal to the prediction interval standard deviation, then the z-score would be 1. Values outside of ± 5 are shown at ± 5.

