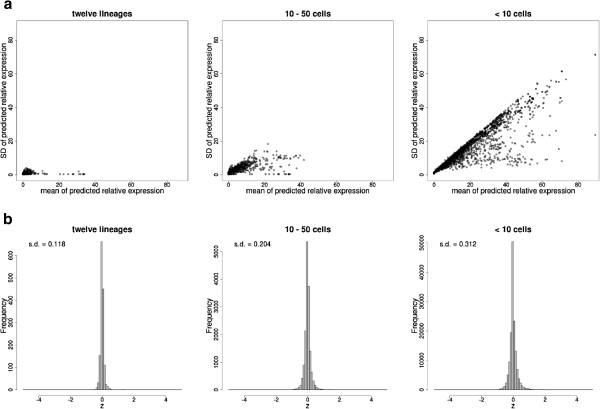
Figure 7.

Sizes of EP prediction bounds for 123 genes, using thirty simulated reporters. a) Mean and standard deviation of predictions for three different sizes of groups of cells. Larger groups of cells correspond to lineages with many cells (prediction is for whether expression is in that lineage, but not which cell within the lineage). All possible lineages were analyzed for each gene. b) Actual expression, scaled to the mean and standard deviation of the prediction to produce z scores as in Figure 6. Values beyond ± 5 are shown at ± 5.
