
Figure 4.
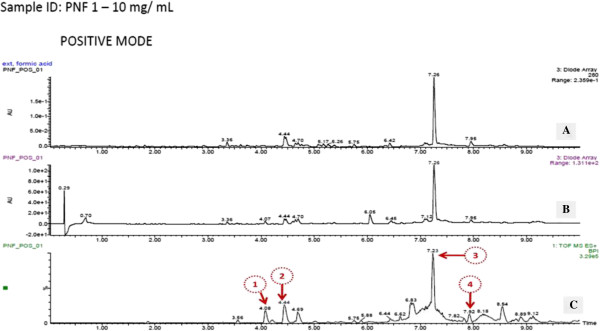
LC-TOF/MS and UV diode array chromatograms of P. niruri fraction 1 (PNF1); (A) UV diode array spectra at 280 nm (B) UV diode array spectra at a range between 190 and 800 nm (C) TOF/MS peaks in the positive mode ionization.
Official websites use .gov
A
.gov website belongs to an official
government organization in the United States.
Secure .gov websites use HTTPS
A lock (
) or https:// means you've safely
connected to the .gov website. Share sensitive
information only on official, secure websites.
LC-TOF/MS and UV diode array chromatograms of P. niruri fraction 1 (PNF1); (A) UV diode array spectra at 280 nm (B) UV diode array spectra at a range between 190 and 800 nm (C) TOF/MS peaks in the positive mode ionization.