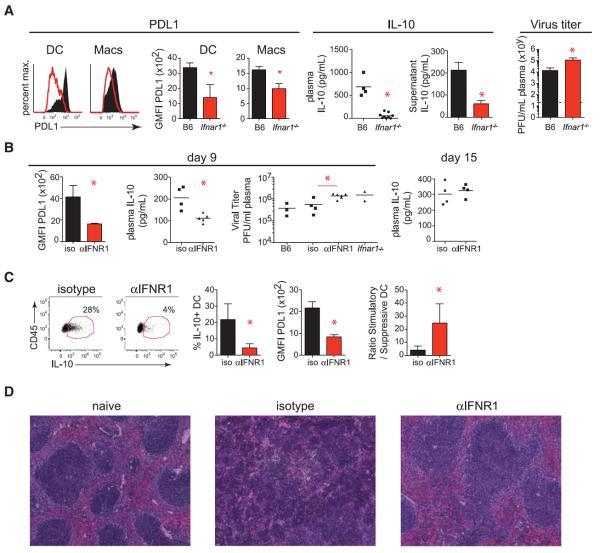
Fig. 2. The immunosuppressive program during persistent infection is dependent on IFN-I signaling.
(A) Representative histograms and summarized quantification of geometric mean fluorescence intensity (GMFI) show PD-L1 on splenic DCs and macrophages 9 days after LCMV-Cl13 infection in wild-type (WT, black) and Ifnar1−/− (red) mice. Scatter plots show plasma IL-10 levels on day 9 after LCMV-Cl13 infection. Bar graphs measure IL-10 production by cultured splenocytes (in the absence of exogenous stimulation) isolated 9 days after LCMV-Cl13 infection from WT or Ifnar1−/− mice. Plasma viral titers in WT or Ifnar1−/− mice on day 9 after LCMV-Cl13 infection are shown to the far right. Dashed lines indicate the level of detection of the plaque assay (200 PFU). (B to D) WT mice were treated with isotype or IFNR1 blocking antibody beginning 1 day before LCMV-Cl13 infection. (B) Graphs indicate GMFI of PD-L1 on splenic CD45+ cells (left), plasma levels of IL-10 (middle), and plasma viral titers (right) of untreated mice (B6), isotype-treated mice, IFNR1 blocking antibody (αIFNR1)–treated mice, and untreated Ifnar1−/− mice. Plasma IL-10 levels on day 15 after LCMV-Cl13 infection are shown on the far right. (C) Flow cytometry plots of IL-10 reporter expression (GFP) in splenic DCs from Vert-X mice treated with isotype or IFNR1 blocking antibody. Bar graphs show the frequency of IL-10 expression and the GMFI of PD-L1 expression by splenic DCs. The ratio of IL-10–nonproducing to IL-10–producing DCs is shown on the far right. (D) Hematoxylin and eosin staining of spleens from naïve mice (left) or on day 9 after LCMV-Cl13 infection of mice treated with isotype (middle) or IFNR1 blocking antibody (right). Symbols represent individual mice with bars indicating the mean of the group. In bar graphs, the data represent the average ± SD of three to six mice per group. All data are representative of two or more independent experiments. *P < 0.05.

