
Figure 2. Spectrum of somatic SV types and mechanisms.
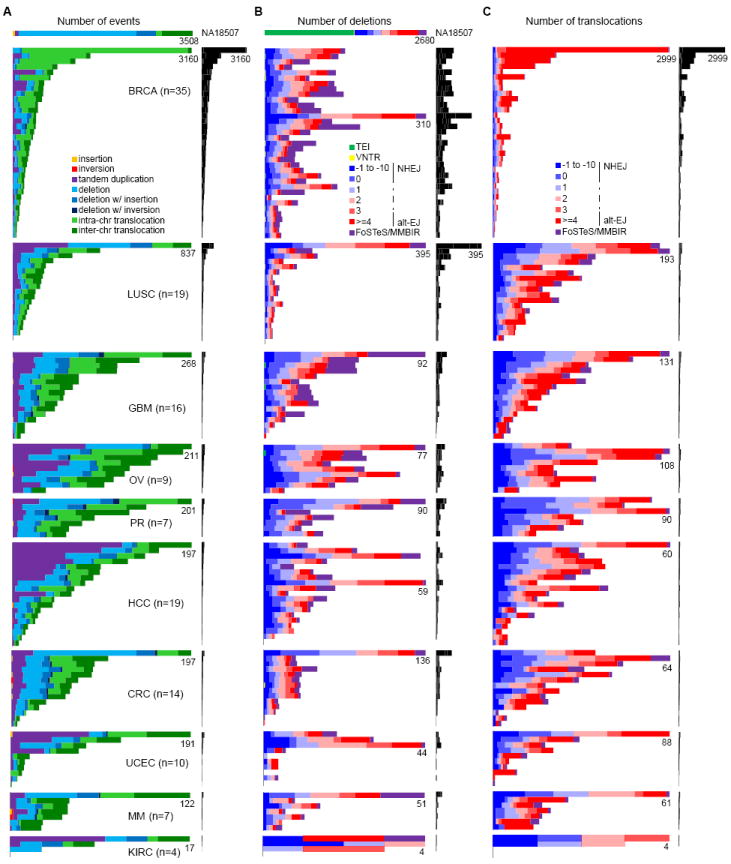
(A) Frequencies of types of somatic SVs identified in each patient. Each horizontal bar displays the number of SVs for one sample. The colored bar charts on the left show the number of events scaled by the maximum number of events (as noted) in each tumor type. The black bar charts on the right show the number of events for all patients on the same scale. A HapMap genome (NA18507) is shown at the top as an example of germline events; see Figure S2 for germline events for all patients. Most (59%) of the translocations in NA18507 are TE insertions, as described previously (Lee et al., 2012), 18% are repeat-related events including TE insertions not identified by Lee et al. 2012, and the remaining ones might be events too complex to be identified by Meerkat.
(B) Frequencies of somatic deletion mechanisms. The order of the samples is the same as in (A).
(C) Frequencies of somatic translocation mechanisms. The order of the samples is the same as in (A).
See also Figure S2 and Table S3, S4 and S5.