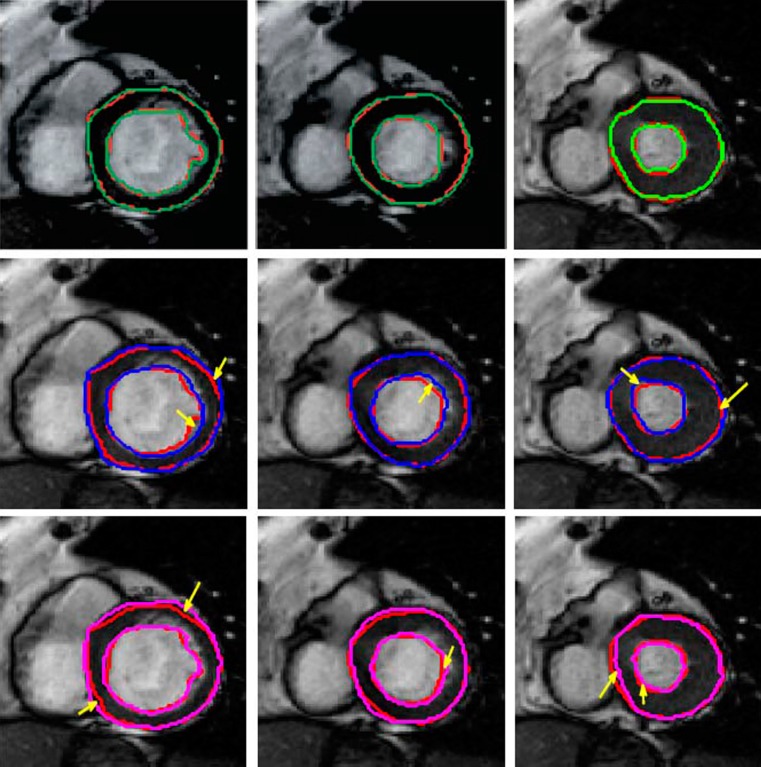
Fig. 2.
Segmentation results of cine MRI using different methods. The manual segmentation is shown in red in all images, and the results for automatic segmentation are shown in different colors. First row shows result for GCSP, second row shows results for GC, and third row shows results for Met. We refer the reader to the online version for a better interpretation of the figures

