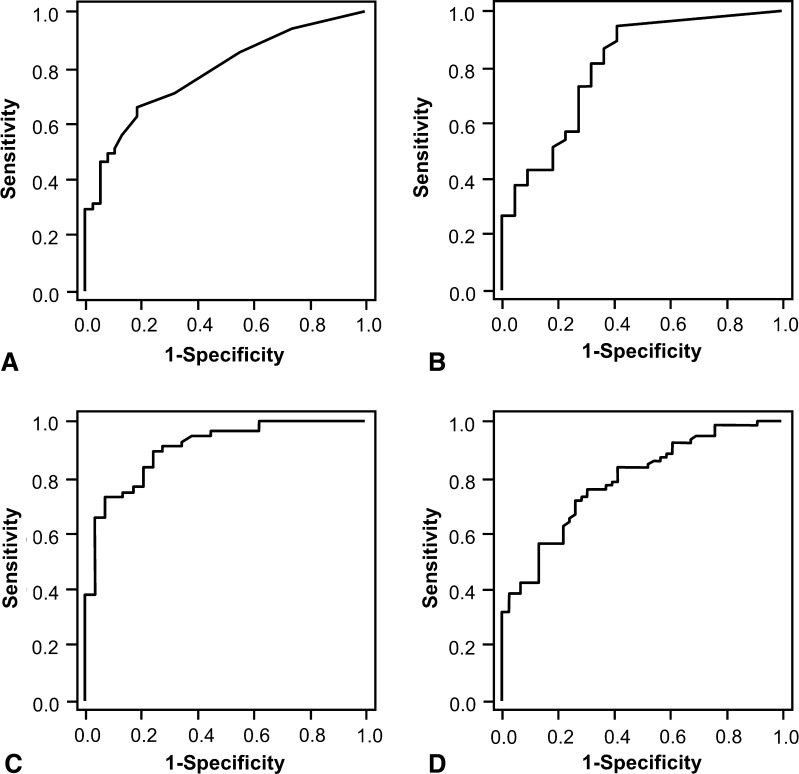
Fig. 1A–D.
ROC curves show the predictive performance of preoperative values of (A) procalcitonin, (B) IL-6, (C) CRP, and (D) leukocyte level for infection, including all operations in the analysis. The ROC curve is a graphic plot of the positive rate (sensitivity) versus the false-positive rate (specificity) for detection of infection. Procalcitonin values of 0.055 and 0.035 ng/mL had sensitivities of 0.77 and 0.89, respectively, and specificities of 0.58 and 0.37, respectively. IL-6 values of 4.7 and 2.55 pg/mL had sensitivities of 0.86 and 0.94, respectively, and specificities of 0.67 and 0.53, respectively. CRP values of 21.95 and 11.00 mg/L had sensitivities of 0.81 and 0.90, respectively, and specificities of 0.80 and 0.74, respectively. Leukocyte levels of 6.58 and 5.68 giga (G) per liter had sensitivities of 0.81 and 0.90, respectively, and specificities of 0.59 and 0.39, respectively. INF-α was a predictor of infection so ROC was not calculated.

