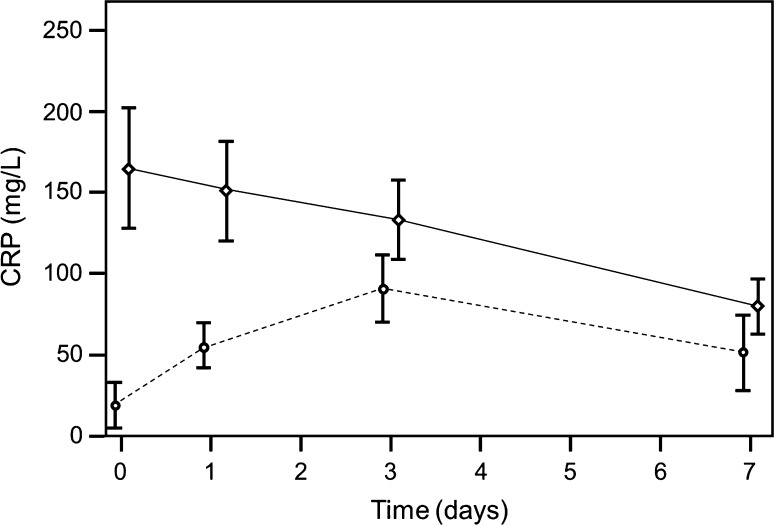
Fig. 5.
A graph shows time-dependent CRP levels (broken line non infection group, solid line infection group; first operation, preoperative = Day 0; operation = Day 1). CRP was highly elevated in the infection group and decreased continuously after surgery until Day 7, whereas in the no infection group, the CRP levels increased after surgery, with a peak at Day 3. The progressions of the two curves differ in a statistically significant manner with time (p < 0.001).

