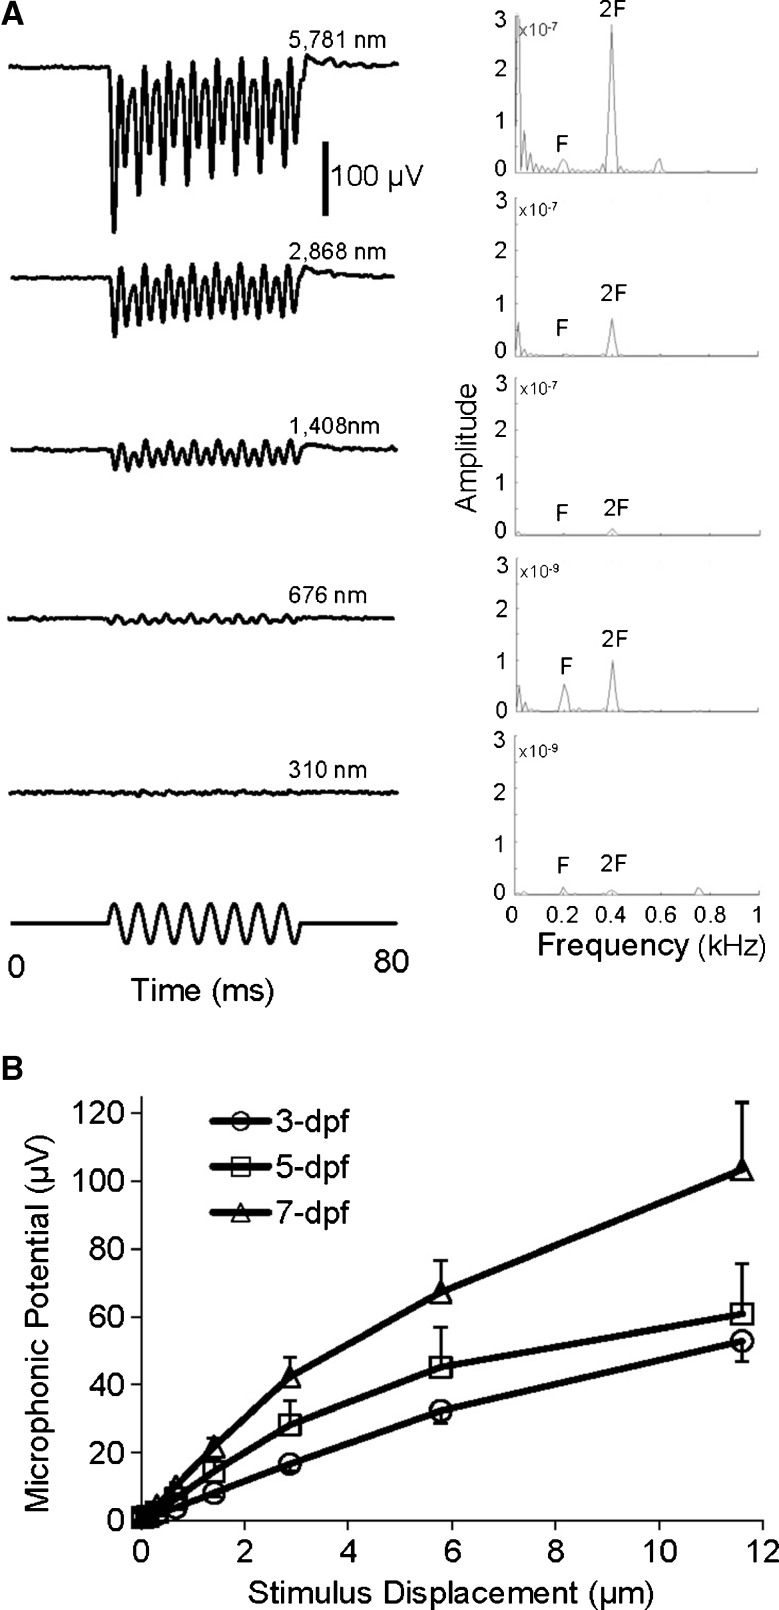
FIG. 5.
A Microphonic waveforms (left column) and FFT plots (right column) of a zebrafish in response to 200-Hz stimuli from small to large displacements indicated in the figure. In each FFT plot, the peak at the stimulus frequency, 200 Hz is marked by F whereas the peak at twice the stimulus frequency is marked by 2F. Note that for the bottom two FFT plots, the Y scales are decreased 100× compared with the top three plots in order to display the peaks at 2F. B Microphonic amplitude versus stimulus level functions of zebrafish at 3, 5, and 7 dpf in response to 200-Hz stimuli (N = 10 each age).

