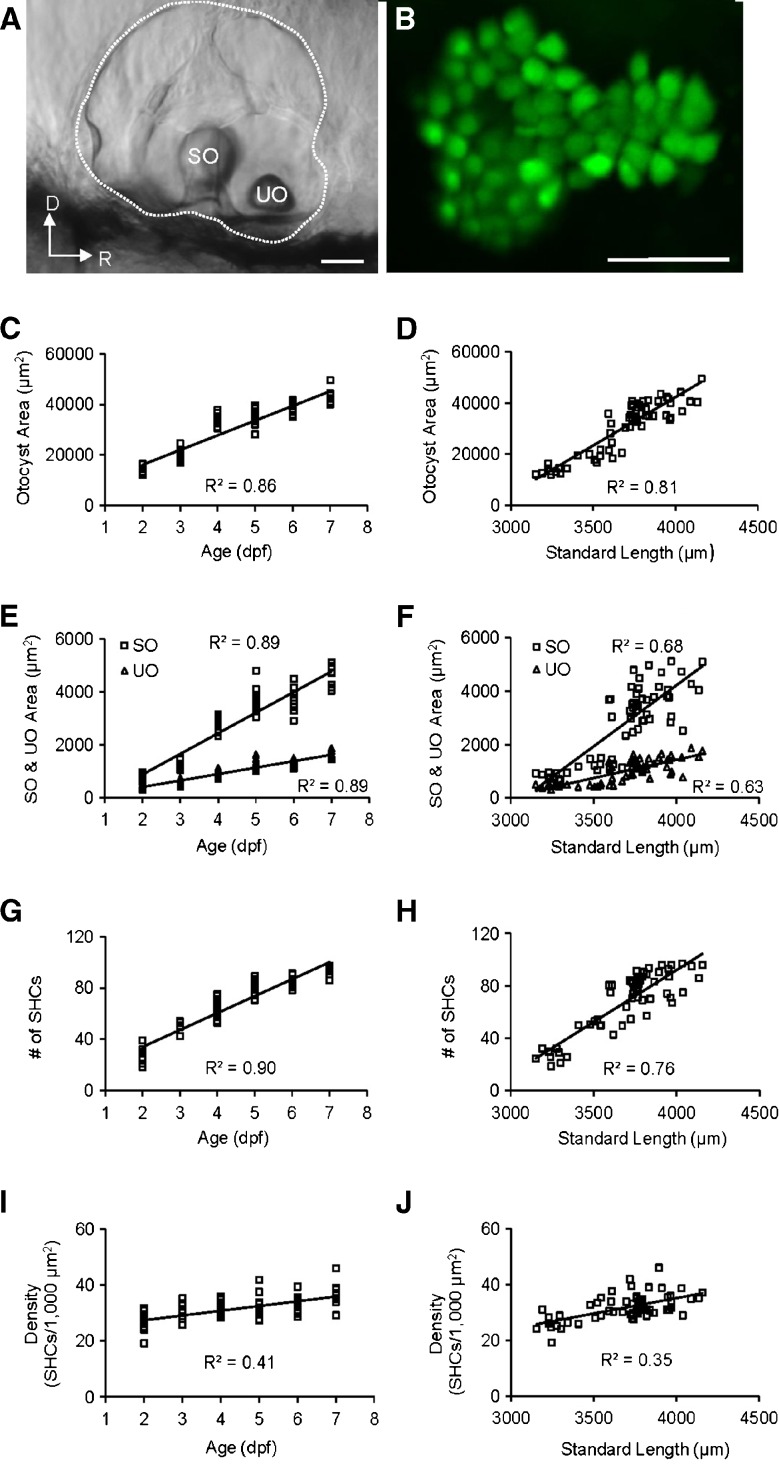
FIG. 6.
A Image of the otic vesicle (indicated by dots) with SO and UO of a 3-dpf zebrafish from the lateral view. D dorsal, R rostral. Scale bar = 50 μm. B Confocal image of saccular hair cell bodies expressing green fluorescent protein of the zebrafish shown in A after the SO was dissolved with 0.5 % Triton X-100. The image in B has the same orientation as the image in A. Scale bar = 25 μm. C Regression of the otocyst area on age (F(1,59) = 355.95, p < 0.0001). D Regression of the otocyst area on standard length (SL, F(1,59) = 255.00, p < 0.0001). E Regression of the SO and UO area on age (SO, F(1,59) = 460.57, p < 0.0001; UO, F(1,59) = 465.48, p < 0.0001). F Regression of the SO and UO area on SL (SO, F(1,59) = 128.09, p < 0.0001; UO, F(1,59) = 99.57, p < 0.0001). G Regression of number of saccular hair cells (SHCs) on age (F(1,68) = 566.55, p < 0.0001). H Regression of number of SHCs on SL (F(1,59) = 128.90, p < 0.0001). I Regression of SHC density (SHCs/1,000 μm2) on age (F(1,68) = 47.89, p < 0.0001). J Regression of SHC density (SHCs/1,000 μm2) on SL (F(1,59) = 33.83, p < 0.0001).

