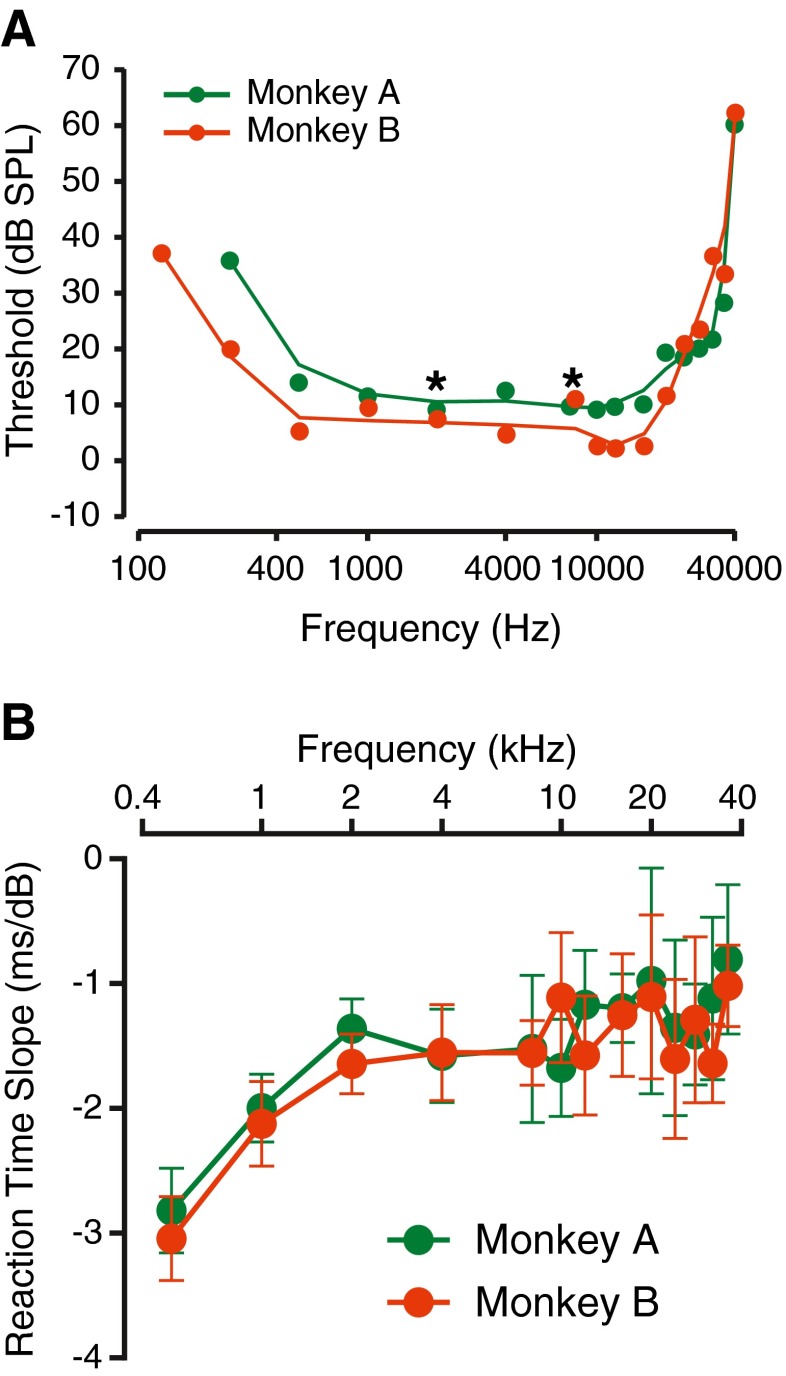
FIG. 3.
Summary of detection metrics for tones presented alone for the two monkeys. A Threshold as a function of tone frequency. Circles show thresholds, and the lines are a cubic spline that shows a smoothed relationship between threshold and frequency. The colors represent different monkeys. B Reaction time slope as a function of frequency. Convention is similar to Figure 3A. Error bars represent 95 % confidence limits, estimated by resampling methods.

