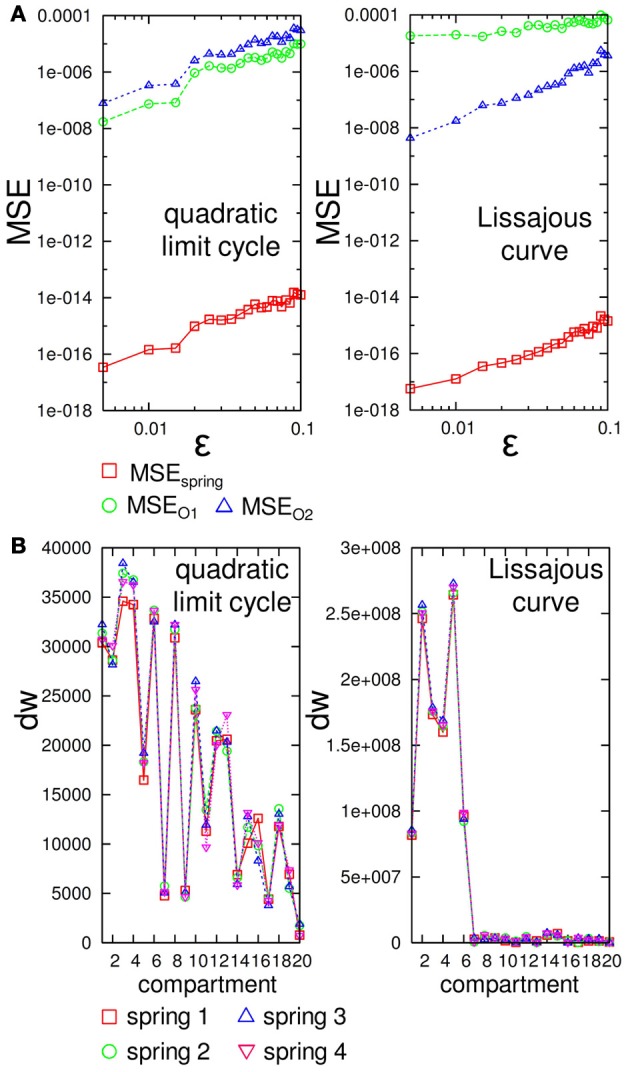
Figure 13.

(A) Plots showing the averaged MSEspring, MSEO1, and MSEO2 according to each noise level ϵ for the embedded quadratic limit cycle (left) and Lissajous curve (right). Each MSE value is averaged over 15 trials by adding a randomly chosen value from [−ϵ, ϵ] to two outputs at timestep 6000. Note that both plots are in log-log plots. (B) Plots showing dw calculated by using the weights wout, 1 and wout, 2 for each spring i in each compartment for the embedded quadratic limit cycle (left) and Lissajous curve (right). See the text for details.
