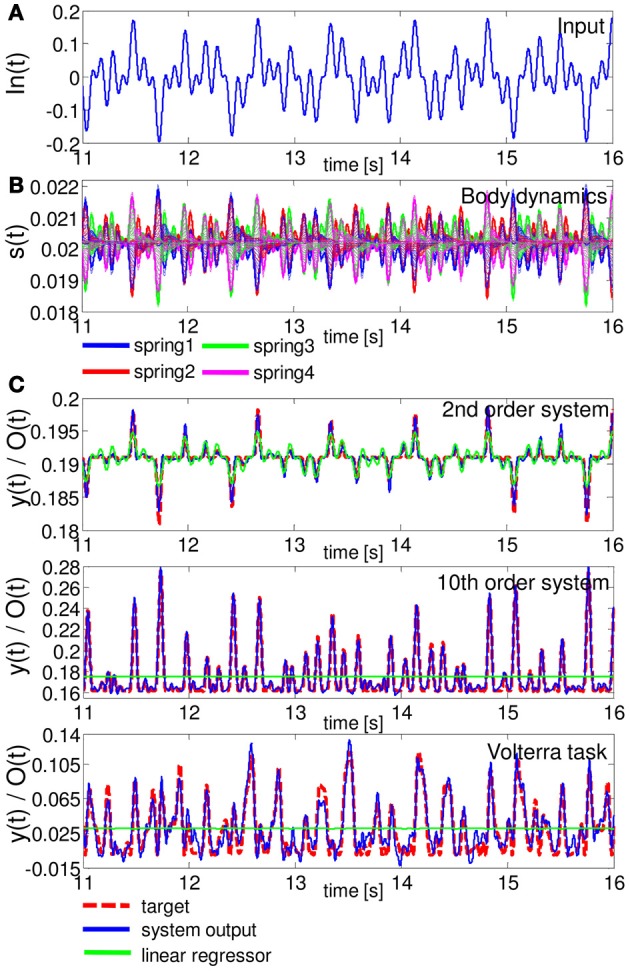
Figure 4.

A typical example of the task performance for Task 1 in terms of time series in the evaluation phase. (A) The time series of In(t). (B) Corresponding body dynamics, which are expressed as the time series of the lengths of springs 1, 2, 3, and 4. The spring dynamics of all 20 compartments are overlaid. (C) Comparisons of the performance of the system output and the linear regressor for the emulation tasks of the 2nd order system (upper diagram), 10th order system (middle diagram), and Volterra task (lower diagram). In the plots, for the 2nd and 10th order systems, and the Voletrra task, the MSEs of the system output were 1.89 × 10⁻⁷, 3.80 × 10⁻⁶, and 8.90 × 10⁻⁵, respectively, and those of the linear regressor were 9.96 × 10⁻⁷, 4.95 × 10⁻⁴, and 9.48 × 10⁻⁴, respectively. For each task, the system output showed better performance than the linear regressor. Note that the output of the linear regressor is not a straight line, but a scaled version of the input with an offset (this outcome is due to the scaling of the figure).
