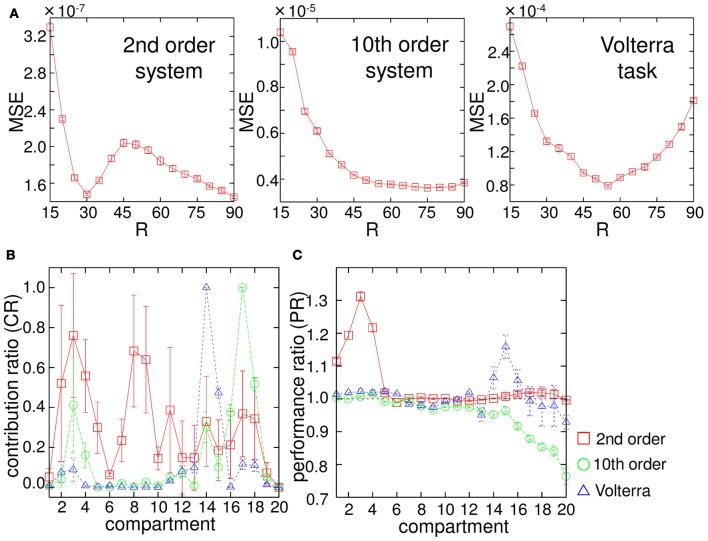
Figure 5.
(A) Dependence of the performance of the system output (MSE) on the base rotation range, R, for each task. The plots show the averaged values of MSE over 20 trials. The error bars show the standard deviation. The averaged value of MSE of the linear regressor was much higher than that of the system output with respect to each R value (usually an order of magnitude higher). (B) Results of the contribution ratio analysis for each task. The horizontal axis shows the number of the compartment discarded in the evaluation phase, and the vertical axis shows the contribution ratio (CR). The plots show the averaged CR values over 20 trials, and the error bars show the standard deviations. (C) Results of the computational power analysis for each task. The horizontal axis shows the number of the compartment excluded to train the readout weights, and the vertical axis shows the performance ratio (PR). The plots show the averaged PR values over 20 trials, and the error bars show the standard deviations. See text for the details.

