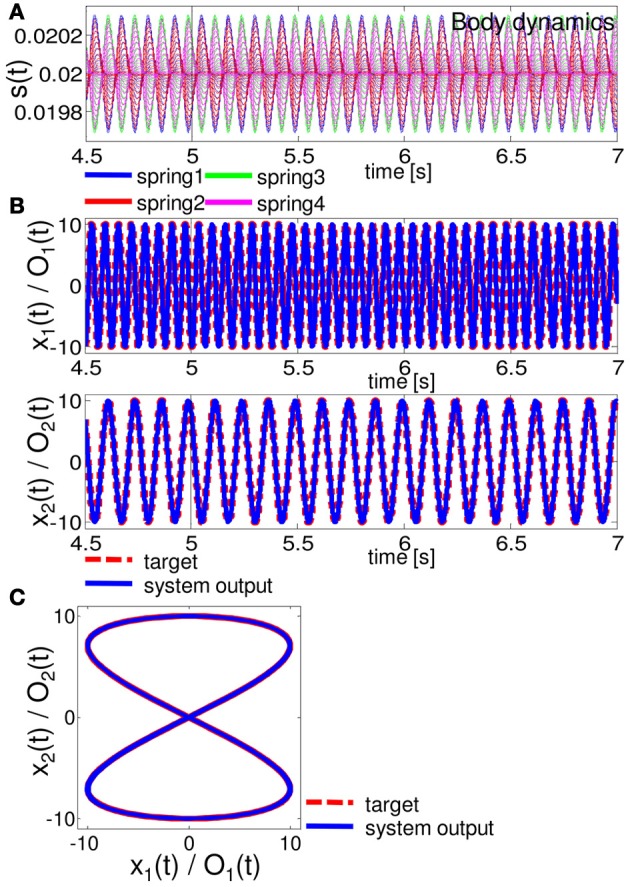
Figure 8.

Results for implementing the Lissajous curve. At timestep 5000, the system is switched from the teacher forcing condition to the closed-loop control (black line). (A). The time series of the lengths of springs 1, 2, 3, and 4 for all 20 compartments. (B) Comparisons between the system output (O1 (t) and O2 (t) (blue lines)) and the target output (x1 (t) and x2 (t) (red lines)). (C) Comparisons between the system output (blue lines) and the target output (red lines) in the O1 (t) - O2 (t) (x1 (t) - x2 (t)) plane. The time series from timestep 5000 to timestep 70,000 are overlaid.
