Fig. 5.
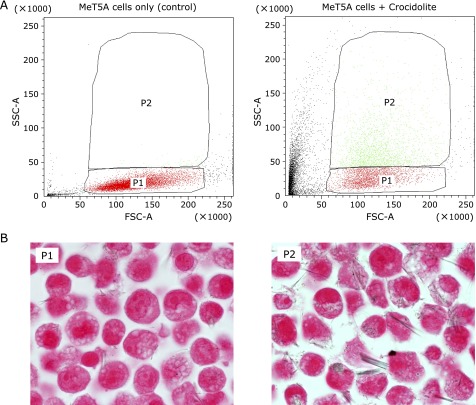
Cell-sorting determined by the degree of SSC. MeT5A cells at 70% confluence were incubated with 20 µg/cm2 crocidolite for 2 h. (A) The cytograms show the presorting dot plots with gated areas (P1: SSC of normal level, P2: increased SSC). The left panel is that of the MeT5A cells without incubation with crocidolite. (B) The cell-block sections of the sorted cells to the gated areas (P1 and P2) after incubation with crocidolite. The P2-gated cells contained much more intracellular crocidolite fibers than the P1-gated cells.

