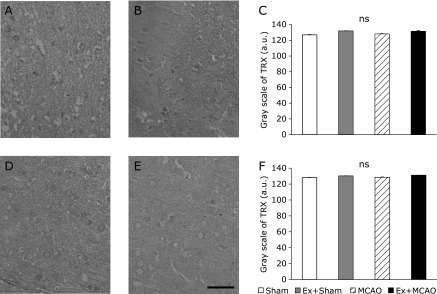
Fig. 6.

The gray scale of TRX. Photomicrographs showing thioredoxin (TRX) immunohistochemistry in the sensory cortex at 24 h after MCAO. MCAO group (A, D); Ex + MCAO group (B, E); the gray scale of TRX in the sensory cortex (C, F) (Scale bar in E; 200 µm). (A, B, C) ipsilateral; (D, E, F) contralateral cortex. Graphs indicate no significant differences in TRX gray scale values in either the ipsilateral or contralateral cortex between groups. Values represent the mean ± SEM. One-way factorial ANOVA followed by Tukey’s post hoc test.
