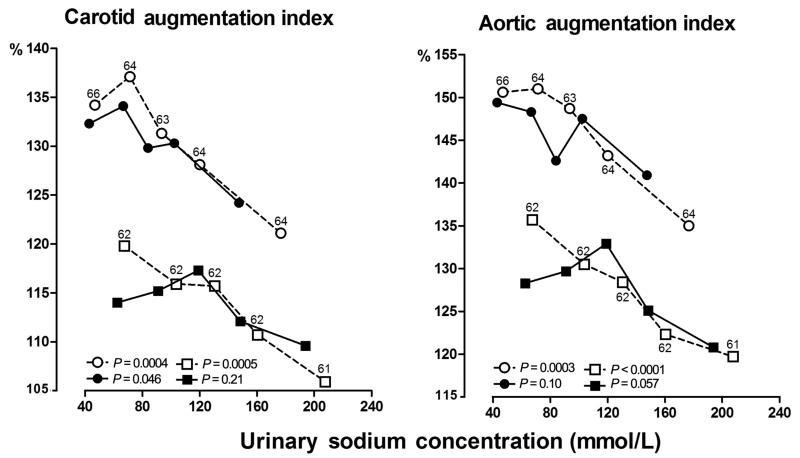
Figure 3.
The carotid and aortic AIs by quintiles of the distributions of the urinary sodium concentration at baseline and follow-up. Circles and squares indicate women and men, respectively. Open and closed symbols indicate baseline and follow-up measurements, respectively. P values are for linear trend across quintiles. Abbreviation: AI, augmentation index.

