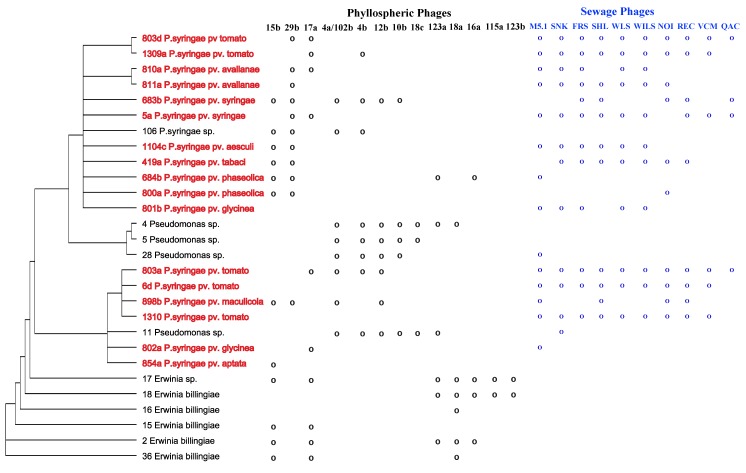
Figure 2.
Neighbor-joining tree showing the phylogenetic relationships among bacteria used in this study and their susceptibility to bacteriophages from the phyllosphere (black) or from sewage (blue). Trees are based on 16S rRNA gene sequences (∼800 bp). Bacterial isolates in red have been classified previously to the pathovar level. Phages 4a and 102b had identical host ranges, despite being isolated from separate leaves, and their profiles have thus been collapsed into one.

