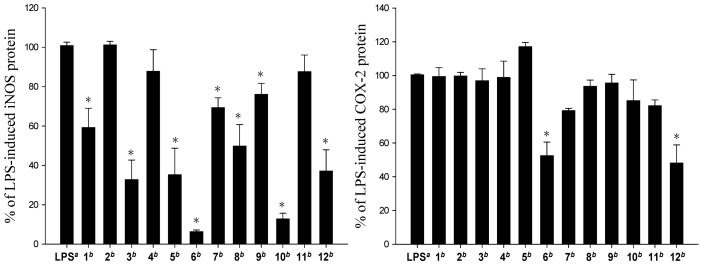
Figure 4.
Effect of compounds 1–12 on LPS-induced iNOS and COX-2 proteins expression in RAW264.7 macrophage cells by immunoblot analysis. The values are mean ± SEM. (n = 6). Relative intensity of the LPS alone stimulated group was taken as 100%.* Significantly different from LPS alone stimulated group (* P < 0.05). a stimulated with LPS, b stimulated with LPS in the presence of 1–12 (10 μM).

