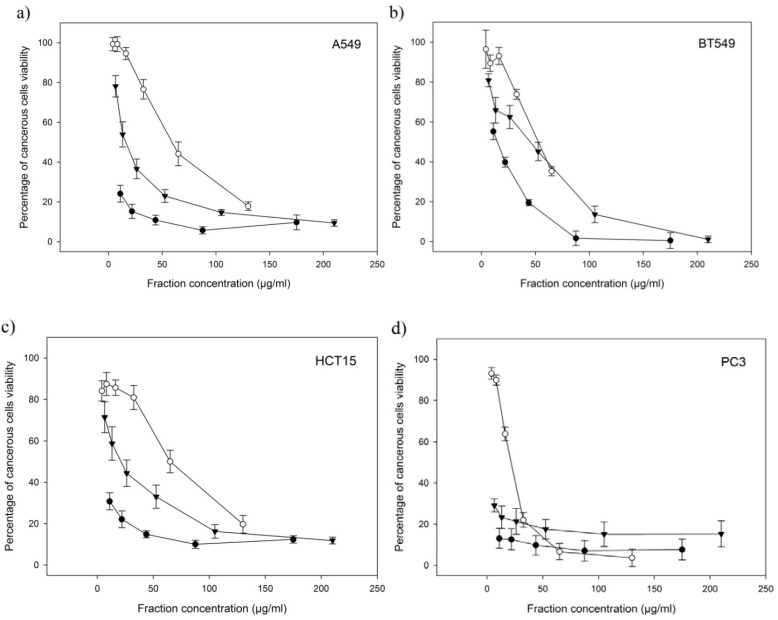
Figure 1.
Percentage of cell viability (cell growth) obtained for each cancerous cell line after a 72 h exposure with the 50 kDa fraction and both A and B sub-fractions. Results are mean values of four replicates ± SE. (a) A549. (b) BT549. (c) HCT15. (d) PC3. As a positive control, Etoposide at a concentration of 60 μM, displayed a cells viability of 0% for A549 cells, of 0% for BT549 cells, lower than 10% for HCT15 cells and lower than 25% for PC3 cells (for n = 3). The black circles represent the results for the 50 kDa fraction; the empty circles, for the A sub-fraction and the black triangles, for the B sub-fraction.

