
Figure 5.
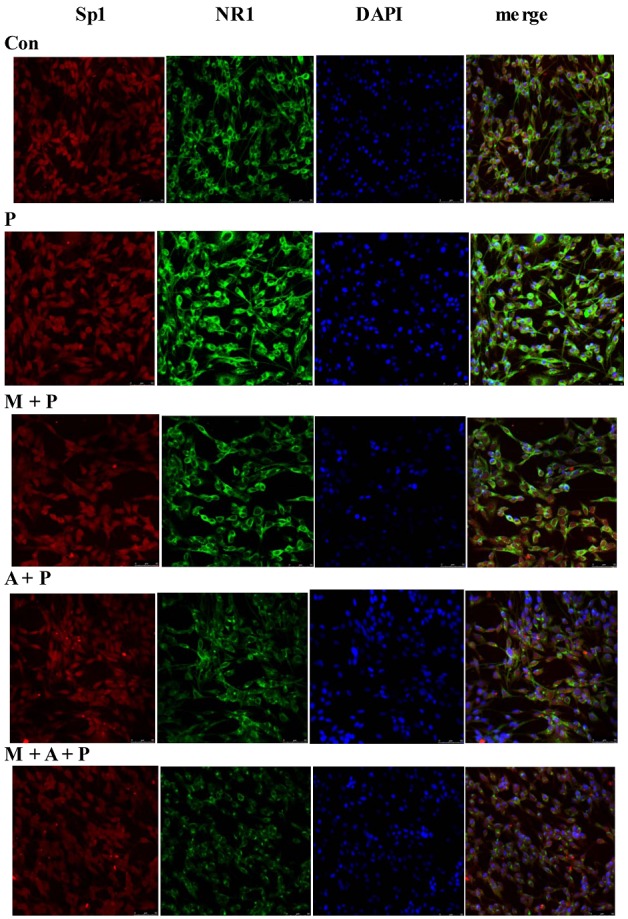
The localization of Sp1 and NR1 protein, as well as nuclear transfer of Sp1 in PC12 cells. The groups were: Con (control group, magnification 200×), P (MPP+ 500 μmol/L group, magnification 200×), M + P (MIT 0.36 μmol/L and MPP+ 500 μmol/L group, magnification 200×), A + P (ATX 10 μmol/L and MPP+ 500 μmol/L group, magnification 200×), M + A + P (MIT 0.36 μmol/L and ATX 10 μmol/L and MPP+ 500 μmol/L group, magnification 200×). Confocal microscopic images of the subcellular localization and expression of Sp1 and NR1. After the administration of MPP+ and other reagents to PC12 cells, Sp1 (Alexa Fluor 594, red fluorescence), NR1 (Alexa Fluor 488, green fluorescence), and nuclei counterstained with DAPI (blue) are shown.