Figure 3.
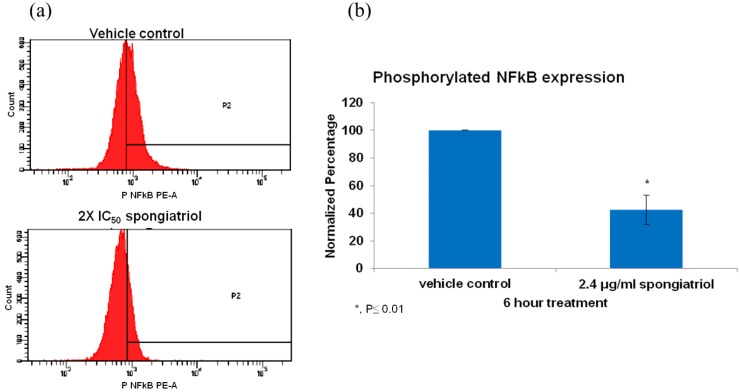
(a) Flow cytometry histograms for phosphorylated NFκB p65 (pS529) in AsPC-1 cells treated for 6 h with vehicle control or 6.8 μM (2.4 μg/mL) spongiatriol (2× IC50 for NFκB inhibition in reporter cell line). Gates were set up against isotype control. One representative experiment is shown. (b) Graphical representations of the flow cytometry data normalized to vehicle control showing the average of three experiments. Error bars represent standard deviation. Statistical significance was determined through the Student’s t-test.

