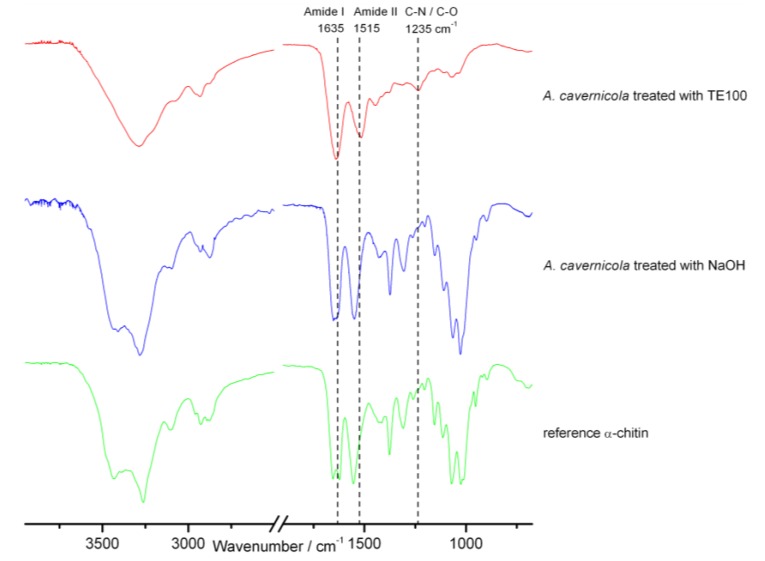
Figure 3.
ATR FTIR spectra of the A. cavernicola skeleton samples after different isolation/preparation steps, except for MeOH extraction (see Figure 2). For comparison, the spectrum of an α-chitin reference sample is also shown. The assignment of the various bands is given in the Supporting Information, Table S1. The corresponding results obtained for I. basta are shown in the Supporting Information, Figure S1.

