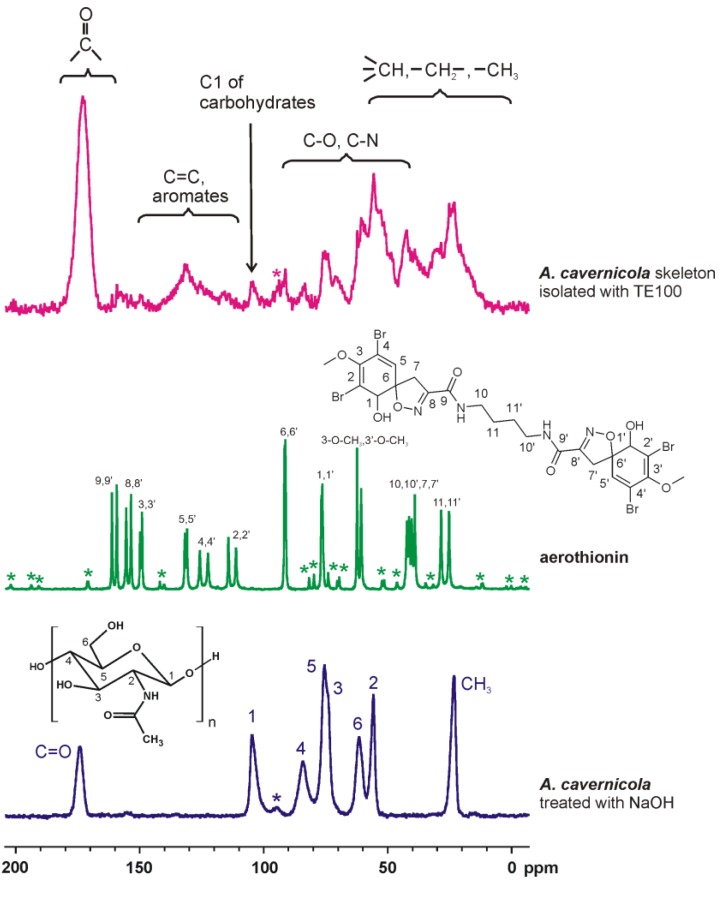
Figure 4.
13C{1H} CP MAS NMR spectra of the skeletons of A. cavernicola after TE100 treatment. For comparison, the spectra of the pure chitin scaffold obtained after NaOH treatment and of pure aerothionin are also shown. The signal assignments follow from the inserts (for aerothionin, see, also, Supporting Information, Figure S2). The corresponding results obtained for I. basta are shown in the Supporting Information, Figures S3 and S4. * denotes spinning sidebands.

