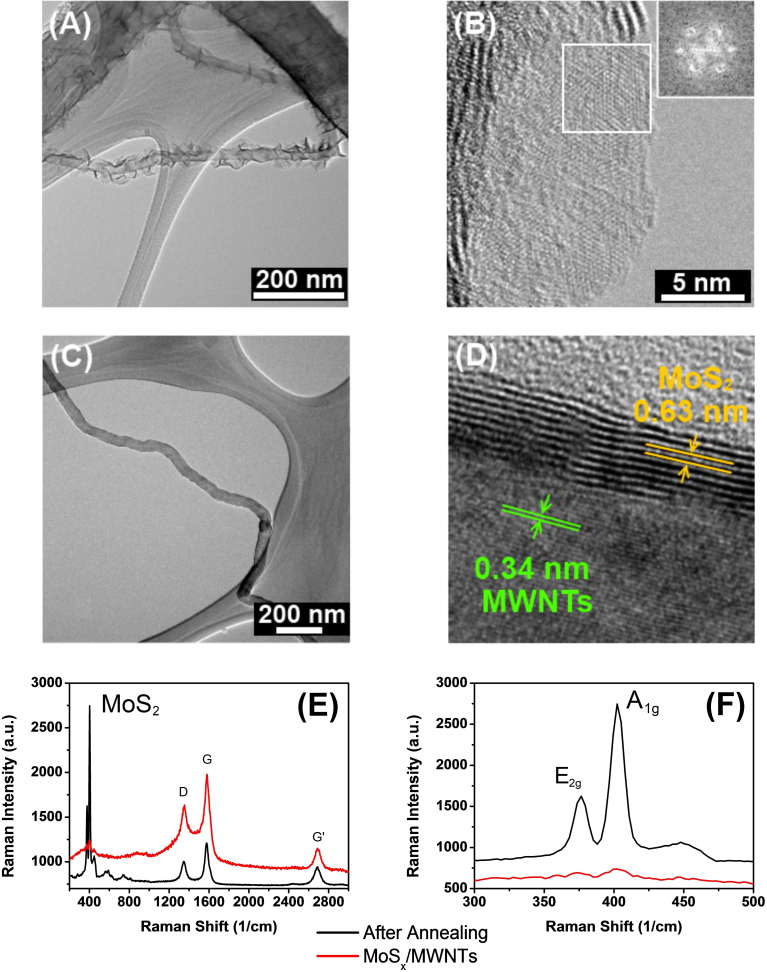
Figure 1. (A) and (C) Low-magnification TEM image of MoSx/MWNTs with hierarchical nanostructure and MoSx/MWNTs after annealing at 800°C under Ar protection, (B) and (D) HRTEM images of a free standing monolayer MoSx and the side wall of the composite after annealing.
Inset in Figure 1 (B) shows the FFT pattern taken from the marked area. (E) Raman spectra of the MoSx/MWNTs. Figure 1 (F) compares the magnified Raman signature of ta prepared MoSx/MWTNs and the one after annealing.

